


Artículo: AMZ-B097T5NRTZ
FNIRSI
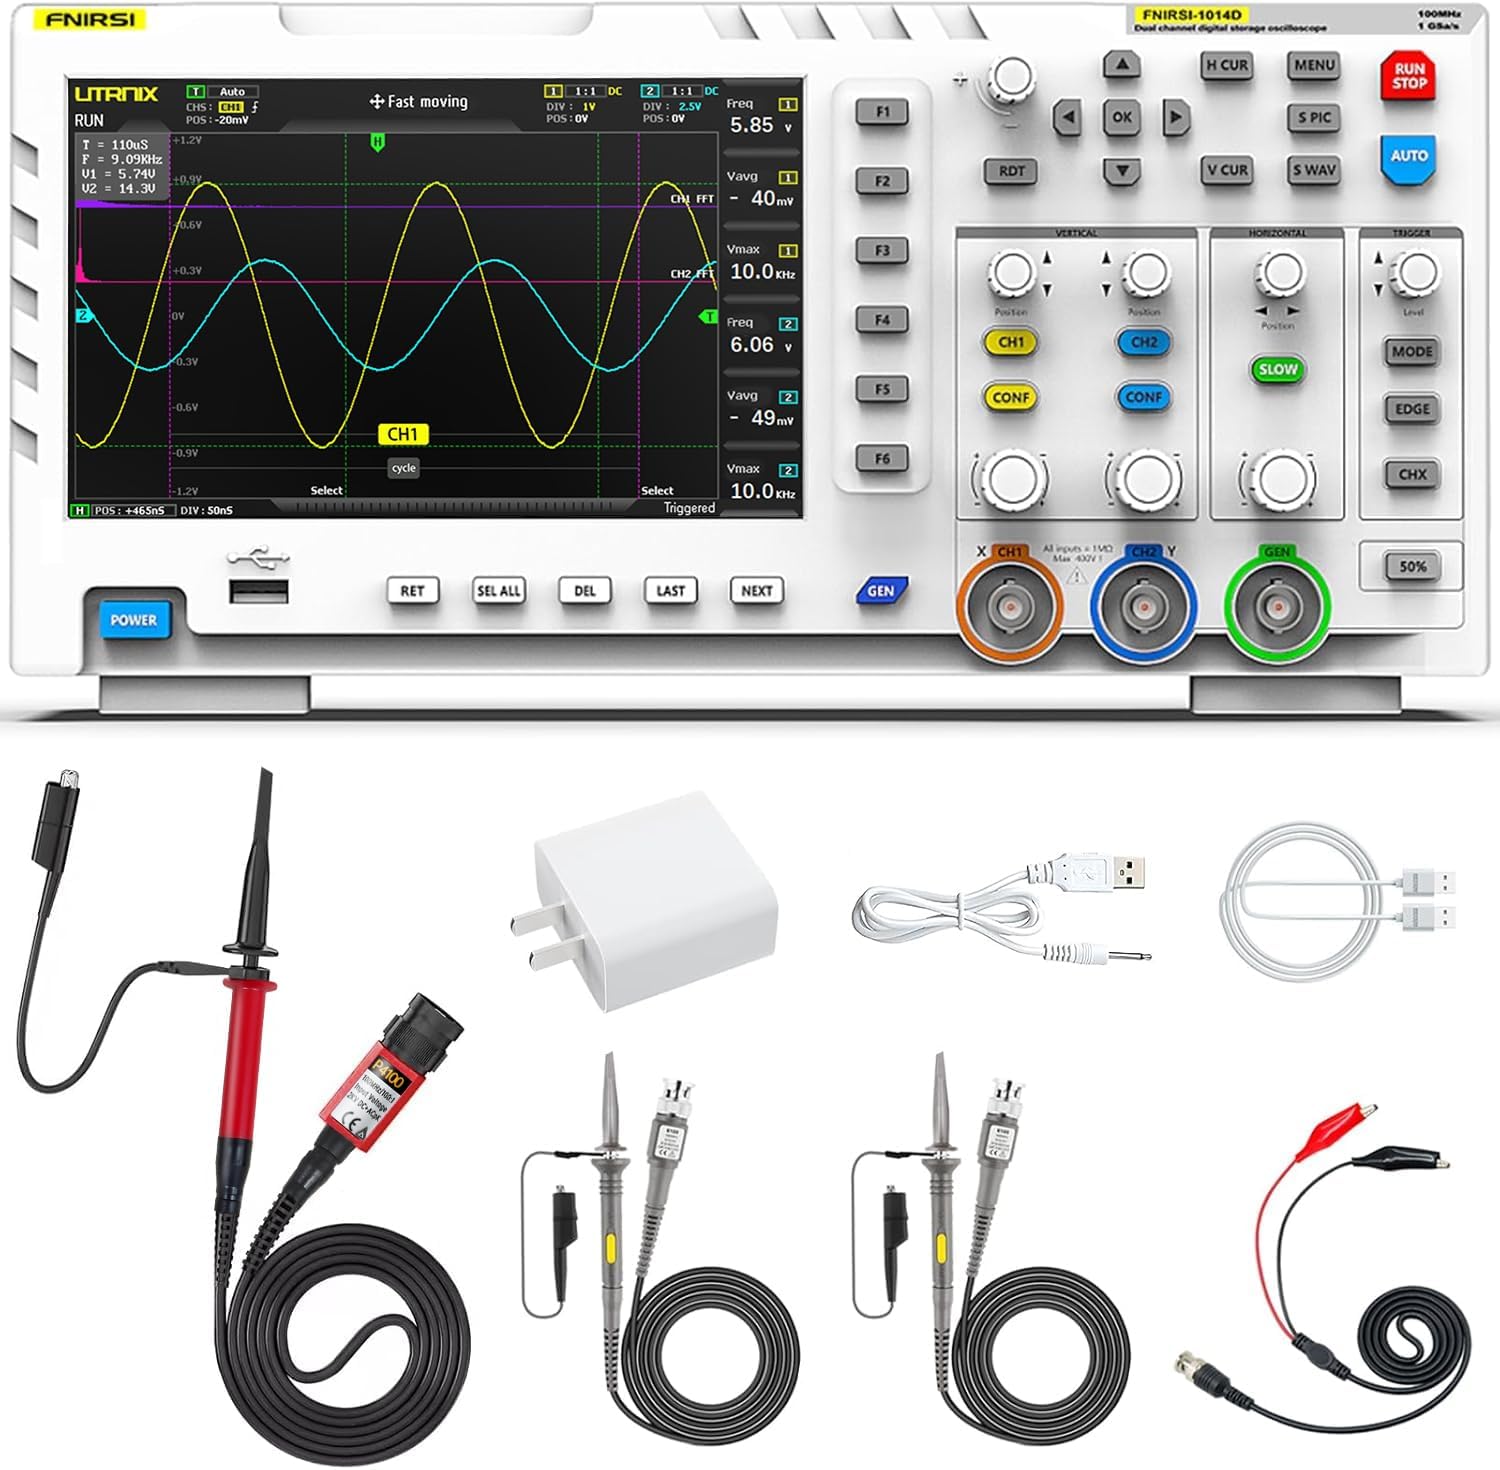
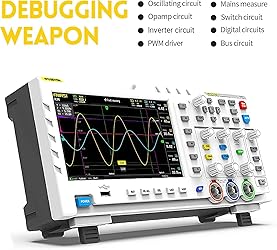
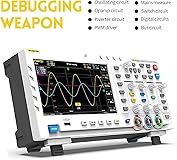
FNIRSI 1014D Oscilloscope 2 in 1 Digital Oscilloscope DDS Signal Generator, 100X High Voltage Probe, 2 Channels 100Mhz Bandwidth 1GSa/s Sampling Rate Built-in 1GB Storage Space
Detalles del producto
Disponibilidad
En stock
En stock
Peso con empaque
1.64 kg
1.64 kg
Devolución
Si
Si
Condición
Nuevo
Nuevo
Producto de
Amazon
Amazon
Viaja desde
USA
USA
Sobre este producto
- Specifications:Material: ABSAna-log band width: 100MHz * 2Number of channels: 2 channelsMaximum real time sampling rate: 1GSa/sVertical sensitivity: 50 mV/div ~ 500 V/divHorizontal time base range: 50S/div ~ 10nS/divMaximum test voltage: 40 V (1X probe), 400 V (10X probe)Storage depth: 240KbitInput resistance: 1MΩADC precision: 8bitsCoupling mode: AC/DCTrigger mode: Single, Normal, AutoTrigger edge: Rising edge/Falling edgeExternal trigger voltage 0~40 VExtension ports: USB picture exportPackage size: 340 * 140 * 70mm / 13.4 * 5.5 * 2.8inPackage weight: 1500g / 3.3lbPacking list:1 * FNIRSI-1014D Oscilloscope Host2 * Matching 100MHz Probe (1X and 10X)1 *Clip1 * 5V2A Power Adapter1 * USB Data Line1 * English User Manual
₡ 92,294
IMPORT EASILY
By purchasing this product you can deduct VAT with your RUT number
₡ 92,294
Con envío
Este producto viaja
de USA ![]() a tus manos en
a tus manos en
![]()
Conocé más detalles
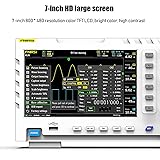
Real-Time Sampling Oscilloscope:Fnirsi oscilloscope has a real-time sampling rate of up to 1GSA/S and an analog bandwidth of 100MHZ * 2. Fnirsi oscilloscope can be triggered by single/normal/automatic, it can be used for both periodic analog signals and aperiodic digital signals DDS Function Signal Generator : Chopping output 2.5 VPP, signal frequency steps are 1 HZ, support 14 kinds of function signals and a customizable chopping signal, which can store up to 1000 customized chopping signals Easily Measuring : Cursor measurement function, when manually reading amplitude-frequency parameters, you do not need to read the background scale unit and quantity, and you can directly get the peak-to-peak value and frequency without conversion Easy to Observe : Equipped with efficiency one-button AUTO, adaptive 25%, 50%, 75% trigger, can display the measured waveform without cumbersome adjustment; the display is equipped with a 7-inch 800*480 resolution LCD screen Lissajous Graphic Display & FFT Viewing: Lissajous graphic display function can be used to compare the amplitude, frequency and phase of the two sets of signals. FFT viewing function can roughly estimation of the harmonic content of the signal
Compra protegida
Disfruta de una experiencia de compra segura y confiable
![]() Garantía de entrega
Garantía de entrega
Con Tiendamia todas tus compras cuentan con Garantía de Entrega o devolución total de tu dinero.
Compras 100% seguras y garantizadas, para que pidas lo que sueñas y lo recibas del mundo a tu puerta.
Tarjetas de Débito y Crédito
Pagando en Colones ( ₡ )
Visa
Mastercard
American Express
Pagos a través de PayPal
Compra procesada en dólares con dinero en cuenta o tarjetas internacionales.
PayPal

